
Dr. Förster Codebreaker: Understanding the Fill-Factor Offset
Eddy current fill factor is one of the most important variables affecting the response of an encircling coil. Yet its influence is often described too simply: increase the fill factor, improve coupling, and obtain a stronger signal.
There is more to the story.
In his treatment of complex effective permeability, Dr. Friedrich Förster illustrated how fill factor affects both the magnitude and position of the normalized electromagnetic response in the complex plane.
His Figure 10 provides an elegant geometric explanation of this relationship.
For this Codebreaker session, we’ll examine the construction and explore what it means for practical eddy current testing.
Understanding Eddy Current Fill Factor
For an idealized circular encircling-coil arrangement, the geometric fill factor can be expressed as:
η = (d/D)2
Where:
- η = geometric fill factor
- d = outside diameter of the cylindrical test object
- D = effective inside diameter of the encircling coil
A fill factor of 1 represents the idealized condition in which the test object occupies the entire effective coil opening.
A fill factor of 0.5 indicates that the test object’s cross-sectional area occupies half the effective coil area.
These values describe geometry. They should not be confused with a universal measure of defect-detection sensitivity.
Real inspection coils have finite winding dimensions, and their electromagnetic coupling also depends on factors not represented by this simple geometric expression.
The Förster Fill-Factor Equation
The central relationship illustrated in Figure 10 is:
P = (1 − η) + ημeff
Here:
- P is the normalized complex response parameter.
- η is the fill factor.
- μeff is the complex effective permeability used in Förster’s model.
- 1 − η represents the contribution associated with the portion of the coil opening not occupied by the test object.
This equation separates the normalized response into two components: a real-axis offset and a material-dependent complex contribution.
It is an idealized model for the geometry and normalization being considered, not a universal equation for every eddy current probe or instrument.
Dr. Friedrich Förster’s contributions helped establish eddy current testing as a practical industrial inspection method. For additional historical background on the development of eddy current instrumentation, see Evident’s History of Eddy Current Testing.
Decoding Figure 10: The O–B–A Vector Construction
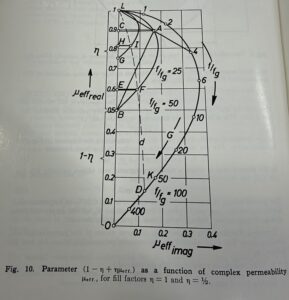
Figure 1. Förster’s original Figure 10: Normalized response parameter as a function of complex effective permeability for fill factors of 1 and 0.5.
The diagram illustrates how the complex effective-permeability response is transformed when fill factor changes.
For η = 0.5:
P = 0.5 + 0.5μeff
Vector OB — The Fill-Factor Offset
Point B lies at 0.5 on the real axis.
OB = 1 − η = 0.5
This is the constant real-axis offset associated with the unfilled portion of the idealized coil opening.
Vector BA — The Material-Dependent Contribution
The vector from B to A represents:
BA = ημeff
For a fill factor of 0.5, the effective-permeability vector is scaled by one-half.
Vector OA — The Resultant Response
The complete response is obtained through vector addition:
OA = OB + BA
Consequently:
P = (1 − η) + ημeff
This construction demonstrates that the normalized response is not simply the effective-permeability vector multiplied by fill factor. It also contains a real-axis translation.
Comparing Fill Factors of 1 and 0.5
When η = 1:
P = μeff
There is no fill-factor offset, and the normalized response coincides with the effective-permeability locus.
When η = 0.5:
P = 0.5 + 0.5μeff
The response locus is scaled by one-half and translated 0.5 units along the real axis.
The corresponding components are:
Re(P) = 1 − η + ηRe(μeff)
Im(P) = ηIm(μeff)
These expressions show how fill factor influences the complex-plane coordinates.
The vector transformation changes the resultant phase angle measured from the origin, even though scaling by a positive real fill factor does not change the direction of the material-dependent vector relative to its translated starting point.
Therefore, reducing fill factor does not universally compress every phase response. Phase behavior depends on the vectors, reference points, and instrument quantities being compared.
Eddy Current Fill Factor and the Frequency-Ratio Curves
Förster’s Figure 10 includes markings for the normalized frequency ratio:
f/fg
Here, f is the test frequency and fg is the characteristic or limit frequency defined within the underlying model.
Förster’s normalized frequency concept is explored further in From Förster to F90: How Eddy Current Testing Evolved from Theory to Field Practice.
The plotted frequency ratios include values such as 1, 2, 4, 6, 10, 20, 50, 100, and 400.
At relatively low normalized frequencies, electromagnetic fields penetrate more deeply into the test object, and the response approaches the low-frequency limit of the model.
As normalized frequency increases, eddy current shielding becomes more significant, and the complex effective-permeability response changes in both its real and imaginary components.
The figure should not be interpreted as a universal defect-sizing curve. Its response depends on the assumptions used to derive the model, including material properties and test-object geometry.
Why Eddy Current Fill Factor Matters in Practice
1. Coil Selection and Coupling
A change in the relationship between test-object diameter and coil diameter changes electromagnetic coupling.
For otherwise comparable inspection conditions, increasing fill factor generally improves coupling between the encircling coil and the test object.
Eddy current fill factor is therefore an important consideration when selecting an encircling coil, but it must be evaluated alongside mechanical clearance, test frequency, and inspection objectives.
2. Signal Interpretation
Changes in test-object position or geometry can produce electromagnetic responses unrelated to discontinuities.
In practical instruments, these effects may appear as changes in signal amplitude, phase, or baseline position.
Understanding fill-factor effects helps inspectors distinguish geometry-related responses from potentially relevant indications.
The constant-offset construction in Förster’s model should not be confused with every signal produced by eccentricity, wobble, or diameter variation. Those effects may require more detailed electromagnetic analysis.
3. Frequency Selection
Test frequency influences penetration, electromagnetic shielding, and the phase relationships of inspection responses.
A frequency appropriate for detecting a surface-breaking discontinuity may not be optimal for detecting a deeper discontinuity or separating geometric interference from material-property variations.
The frequency-ratio curves in Förster’s figure illustrate why frequency selection must be considered alongside coil geometry.
4. Calibration and Reference Standards
Reference standards should reproduce relevant inspection conditions as closely as practical.
Differences in diameter, centering, material properties, or coil geometry can change the response and complicate comparisons between calibration signals and actual inspection data.
Modern instruments provide balancing, phase rotation, filtering, and other signal-processing capabilities, but these operations do not eliminate the underlying electromagnetic influence of fill factor.
Eddy Current Fill Factor in Modern Inspection Instruments
Modern eddy current instruments can display and manipulate signals in ways unavailable to early researchers.
Digital balancing, phase rotation, gain adjustment, multifrequency processing, and software-based analysis make inspection data easier to evaluate.
However, these functions should not be confused with physically removing the effects of coil geometry.
Balancing may translate a displayed signal to a selected reference point, but it does not change electromagnetic coupling between the probe and test object.
Similarly, phase rotation changes the orientation of the displayed response without altering the underlying inspection conditions.
Förster’s model helps explain the electromagnetic relationships that exist before display adjustments are applied.
For additional practical study, explore the Eddy Current Calculators and Visualization Tools, including the coil-loading visualization.
Practical Recommendations for ECT Professionals
- Calculate the geometric fill factor. Use the test-object diameter and appropriate effective coil diameter, recognizing the model’s assumptions.
- Evaluate mechanical clearance. Avoid selecting a coil solely because it provides the highest theoretical fill factor.
- Control test-object positioning. Changes in centering and geometry may produce signals that interfere with discontinuity detection.
- Select test frequency deliberately. Consider conductivity, permeability, inspection objectives, penetration requirements, and phase separation.
- Use representative reference standards. Calibration should account for conditions that materially affect inspection response.
- Understand display adjustments. Balancing, phase rotation, and gain changes do not eliminate the physical effects of electromagnetic coupling.
- Verify inspection performance. Detection capability must ultimately be demonstrated using appropriate reference standards and qualified inspection procedures.
Final Thoughts: The Value of Förster’s Fill-Factor Model
The most important lesson from Förster’s Figure 10 is that eddy current fill factor influences the complex response through both scaling and translation.
P = (1 − η) + ημeff
This relationship provides a concise mathematical description of that behavior within the idealized encircling-coil model.
Understanding the construction helps explain why coil geometry matters, why signal interpretation requires an appropriate reference, and why changes in coupling cannot always be understood as simple amplitude changes.
Although modern digital instruments provide sophisticated processing and display capabilities, the electromagnetic principles illustrated by Förster remain relevant.
That is the value of revisiting historical technical literature: sometimes a diagram drawn decades ago provides a clearer explanation than pages of modern instrument specifications.
Explore more: Visit EddyCurrent.com’s ECT Calculators and Visualization Tools to continue exploring the physics of electromagnetic testing.