
The One Slide That Explains Eddy Current Testing
If you understand this, you understand the fundamentals of ECT
The Slide
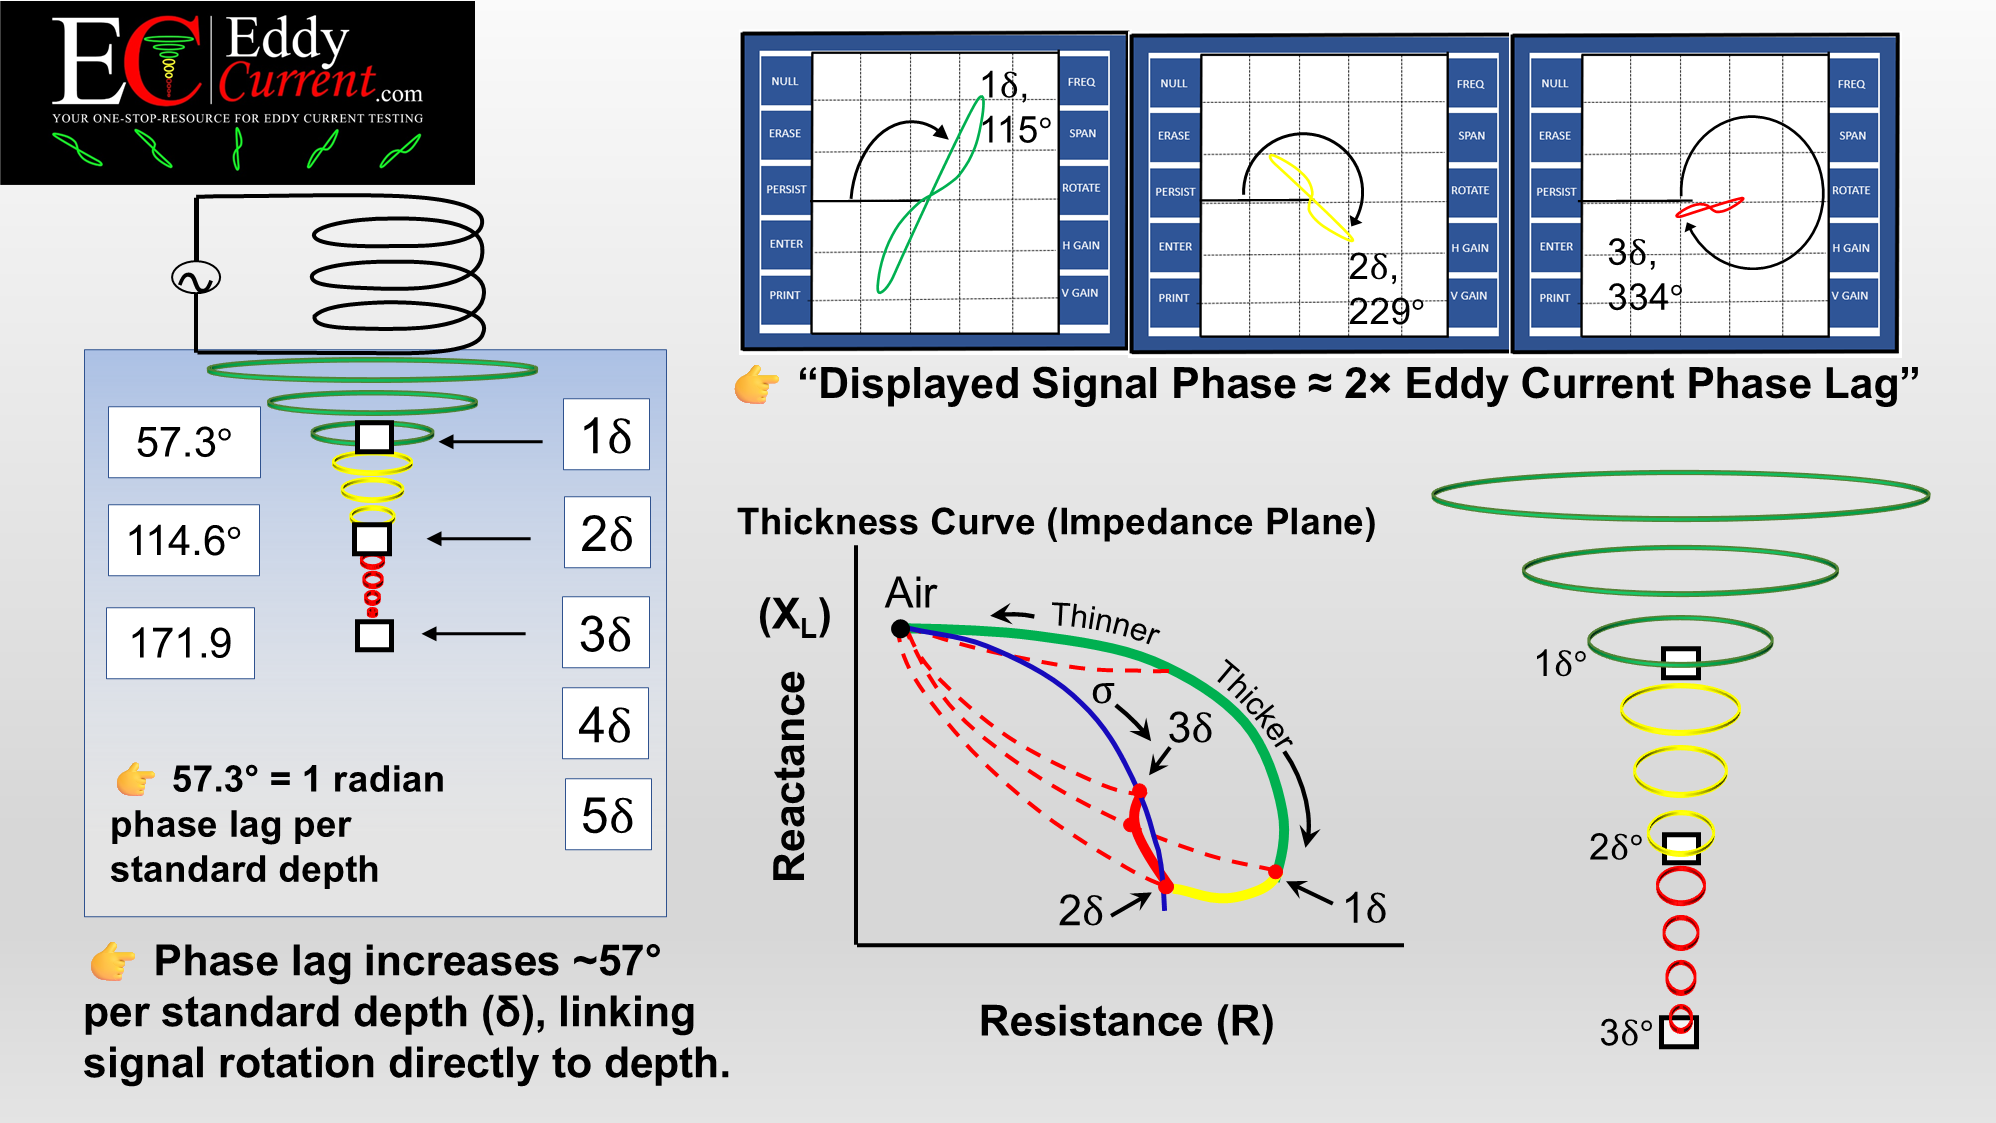
Figure 1 – The δ–Phase–Impedance relationship: linking coil physics to signal interpretation
Why This Slide Matters
Most eddy current training teaches pieces of the puzzle:
- how the probe works
- how to calibrate the instrument
- what the impedance plane looks like
But very few explanations connect:
what’s happening in the material → to what you see on the screen
That’s what this slide does.
Start with the Physics: Standard Depth (δ)
On the left side of the slide, you see the concept of standard depth of penetration (δ).
At each depth:
- 1δ → ~57.3° phase lag
- 2δ → ~114.6° phase lag
- 3δ → ~171.9° phase lag
That’s not a coincidence.
👉 57.3° = 1 radian
So what you’re really seeing is:
Phase lag increases by ~1 radian per standard depth
What That Means Physically
As eddy currents penetrate deeper:
- they weaken
- they lag further behind the excitation field
- their contribution to the signal changes
So depth is not just about amplitude.
👉 It’s about phase shift
Now Look at the Screen
At the top of the slide, you see impedance plane displays:
- shallow response → small phase angle
- deeper response → larger phase rotation
And here’s the key relationship:
👉 Displayed Signal Phase ≈ 2 × Eddy Current Phase Lag
This happens because:
- the probe both excites and senses the field
- the interaction is effectively doubled in the measurement
The Missing Link Most People Never See
This is where the slide becomes powerful.
You can now connect:
- Depth (δ)
→ Phase lag (~57° per δ)
→ Displayed phase (~2×)
→ Rotation on the impedance plane
That’s the chain.
The Thickness Curve (Where It All Comes Together)
In the center, the thickness curve shows how signals move on the impedance plane.
- Starting point: air (no coupling)
- Moving along the curve: increasing thickness
- Trajectory: changing resistance and reactance
This is what you’re actually watching during an inspection.
👉 Not just “a signal”…
👉 but a path tied directly to material conditions
What the Right Side Represents
On the right, you see a simplified visualization:
- large loops (green)
- medium loops (yellow)
- small loops (red)
This mirrors what happens as depth increases:
- signal strength decreases
- phase increases
- interpretability changes
This is the same concept encoded in the logo and earlier visuals:
👉 It’s a signal behavior model, not a current flow diagram
Why This Matters for Real Inspections
In the field, you’re not solving equations.
You’re answering questions like:
- Is this flaw shallow or deep?
- Is this signal real or noise?
- Can I size this accurately?
This slide gives you the framework to answer those questions.
Because now you understand:
Signal rotation is not arbitrary—it is tied directly to depth through phase lag
The Key Takeaway
👉 Phase lag increases ~57° per standard depth (δ), linking signal rotation directly to depth.
If you remember nothing else, remember that.
Final Thought
Eddy current testing isn’t just about equipment settings or procedures.
It’s about understanding what the signal is telling you.
And once you see the connection between:
- depth
- phase
- impedance plane motion
👉 everything else starts to make sense.
Want to Learn More?
Visit eddycurrent.com for:
- eddy current training resources
- signal interpretation guidance
- deeper dives into ECT fundamentals
Because at the end of the day:
It’s not about memorizing signals
It’s about understanding what they mean